

How low will 10-year Treasury yield get in October?
Markets
Below 4.85%
- Yes17%
- No83%
Volume $528.2 · Liquidity $386
Below 4.90%
- Yes11%
- No89%
Volume $260.5 · Liquidity $85.4
Below 5.12%
- Yes59%
- No42%
Volume $200.2 · Liquidity $54.4
Below 4.95%
- Yes20%
- No81%
Volume $139.2 · Liquidity $264.6
Below 5.18%
- Yes76%
- No24%
Volume — · Liquidity $48.6
Below 5.15%
- Yes50%
- No51%
Volume — · Liquidity $22.6
Below 5.09%
- Yes28%
- No72%
Volume — · Liquidity $36.7
Below 5.05%
- Yes28%
- No72%
Volume — · Liquidity $31
Below 5.00%
- Yes25%
- No76%
Volume — · Liquidity $64.1
Resolution rules
This market will resolve to "Yes" if the Treasury 10-year yield is lower than the listed value for any date between October 2, 2026 and October 31, 2026. Otherwise this market will resolve to "No". This market will resolve as soon as the Treasury 10-year yield is lower than the listed value, or once data is available for the last business day of October 2026. If no qualifying value is published and data is not available for the last business day of October 2026 by November 13, 11:59 PM ET, this market will resolve to "No". The resolution source for this market is the Department of the treasury, specifically the data listed under "Daily Treasury Par Yield Curve Rates" for the column "10 Yr" (see:
How to read these odds
Each price runs from $0 to $1 and can be read as the probability the market assigns to an outcome: $0.62 means roughly 62%. Prices move with every trade, so they are a crowd estimate, not a guarantee. Before trading, check the resolution rules above, the volume and the liquidity, and only risk money you can afford to lose.
More Economy markets

How high will 10-year Treasury yield go before 2027?
5.3%: 88%
24h vol $18.3K · Ends Jan 1, 2027

How low will 2-year Treasury yield get in October?
Below 4.73%: 72%
24h vol $1.5K · Ends Nov 1, 2026
How high will 2-year Treasury yield go in October?
4.86%: 86%
24h vol $1.1K · Ends Nov 1, 2026
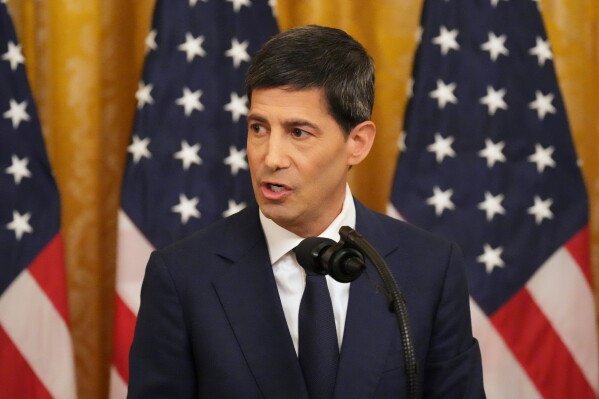
Fed Decision in October?
No change: 75%
24h vol $2.3M · Ends Oct 29, 2026
No change or Hike 25 bps favored on October 27?
No change: 79%
24h vol $1.7K · Ends Oct 27, 2026
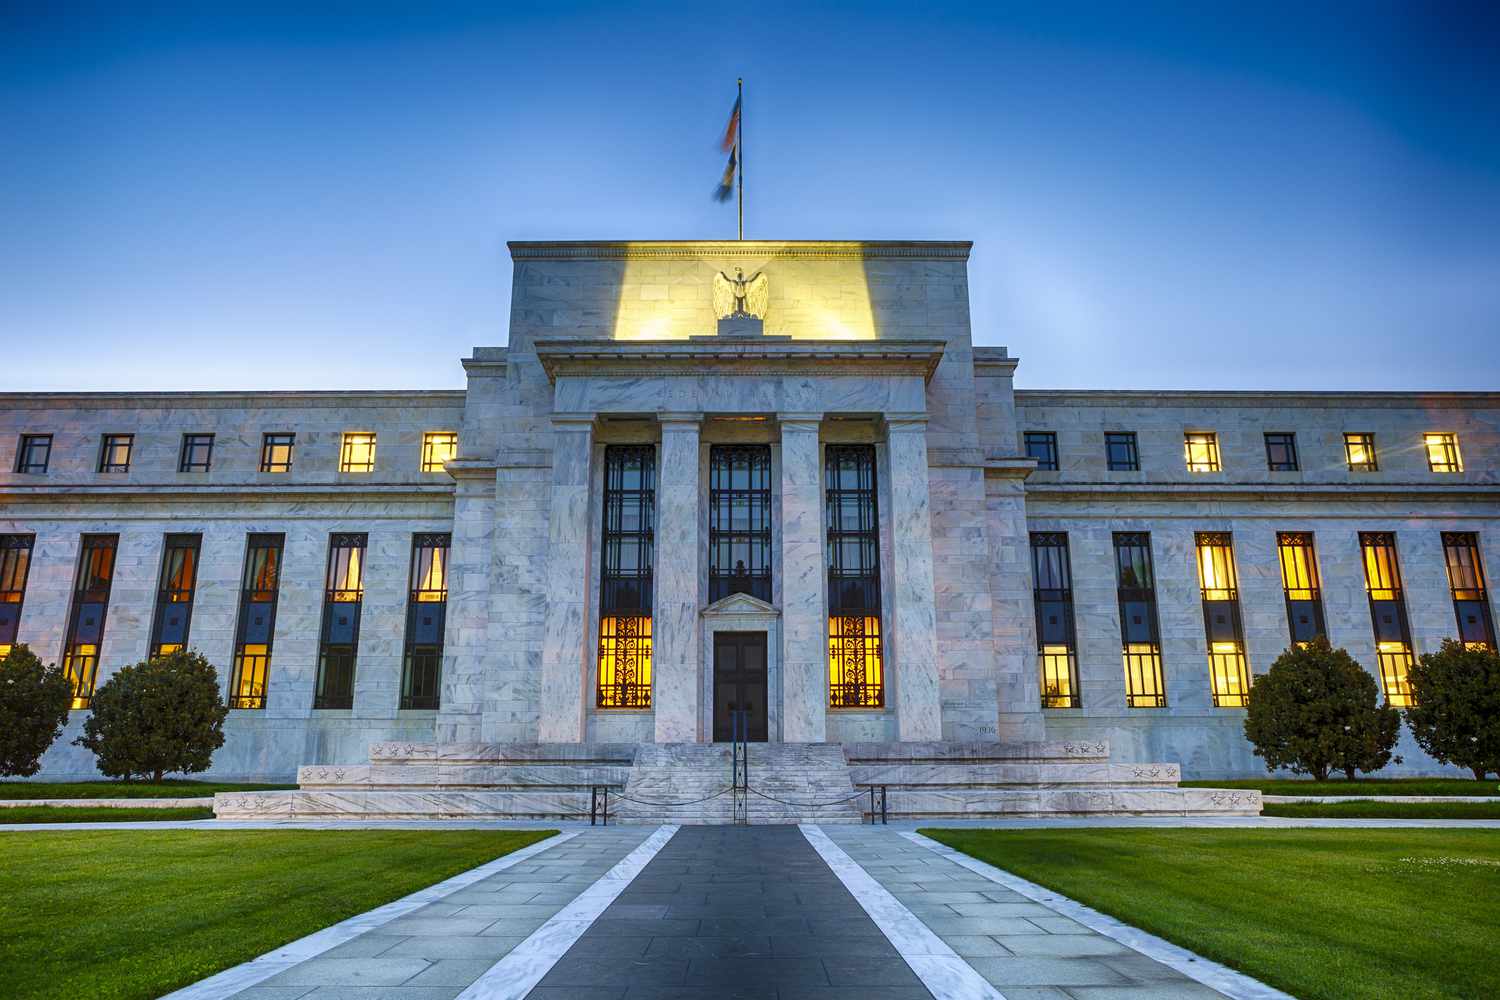
Fed decisions (Sep–Dec)
Hike–Pause–Hike: 53%
24h vol $16.6K · Ends Dec 9, 2026
Fed Decision in December?
25 bps increase: 68%
24h vol $162.8K · Ends Dec 10, 2026

Another Fed rate hike in 2026?
Yes: 80%
24h vol $28.5K · Ends Dec 10, 2026
How high will 30-year Treasury yield go before 2027?
5.65%: 73%
24h vol $8.1K · Ends Dec 31, 2026
How high will 5-year Treasury yield go before 2027?
5.10%: 84%
24h vol $4.4K · Ends Dec 31, 2026
How low will 30-year Treasury yield get before 2027?
Below 5.20%: 48%
24h vol $1.8K · Ends Dec 31, 2026
How low will 5-year Treasury yield get before 2027?
Below 4.50%: 19%
24h vol $1.3K · Ends Dec 31, 2026