

UK Annual GDP Growth 2026
{name}: aktuālās varbūtības
1-2%
- Yes91%
- No9%
Volume $44.1K · Liquidity $1.1K
0-1%
- Yes7%
- No93%
Volume $27.3K · Liquidity $1.5K
<0
- Yes1%
- No99%
Volume $13.1K · Liquidity $1.4K
4-5%
- Yes1%
- No99%
Volume $10.6K · Liquidity $2.6K
2-3%
- Yes2%
- No98%
Volume $6.2K · Liquidity $1.6K
5%+
- Yes0%
- No100%
Volume $5.6K · Liquidity $2.5K
3-4%
- Yes0%
- No100%
Volume $4.6K · Liquidity $2.1K
Iznākuma noteikšanas noteikumi
This market will resolve according to the estimate of UK real gross domestic product (GDP) across the year of 2026 (% change) in the "GDP First quarterly estimate, UK" release for October-December (Q4) of 2026, scheduled for February 12, 2027. If the reported value falls exactly between two brackets, then this market will resolve to the higher range bracket. The GDP release will be made available here: The estimate of UK real GDP across the year of 2026 is an estimate of the rate at which real GDP changed, on average, throughout the year of 2026. The relevant figure may be found in “Table 1: Headline national accounts indicators for the UK” under “GDP (Chained Volume Measures)” for the relevant year, or elsewhere in the release. If no data for the estimate of UK real gross domestic product (GDP) across the year of 2026 is included in this release, this market will resolve according to the rate at which UK real gross domestic product (GDP) changed in Q4 compared with the same quarter of the previous year. If neither figure is released by the date the next quarter's GDP first quarterly estimate is scheduled to be released, this market will resolve based on quarterly data (compared to the same quarter in the previous year) from the last available quarter. Note: data from the initial release of the referenced GDP report is what will be used to resolve this market. Data may be revised during the following quarter or as a part of the next estimate's publication, however any revisions to GDP report data made after the initial release will not be considered for this market's resolution.
Kā interpretēt šīs varbūtības
Katra cena ir robežās no 0 līdz 1 ASV dolāram, un to var interpretēt kā varbūtību, ko tirgus piešķir konkrētam iznākumam: 0,62 ASV dolāri nozīmē aptuveni 62%. Cenas mainās ar katru darījumu, tāpēc tās atspoguļo tirgus dalībnieku kopējo vērtējumu, nevis garantiju. Pirms tirdzniecības iepazīsties ar iepriekš norādītajiem iznākuma noteikšanas noteikumiem, pārbaudi tirdzniecības apjomu un likviditāti un riskē tikai ar naudu, ko vari atļauties zaudēt.
Vairāk tirgu par tēmu “Ekonomika”
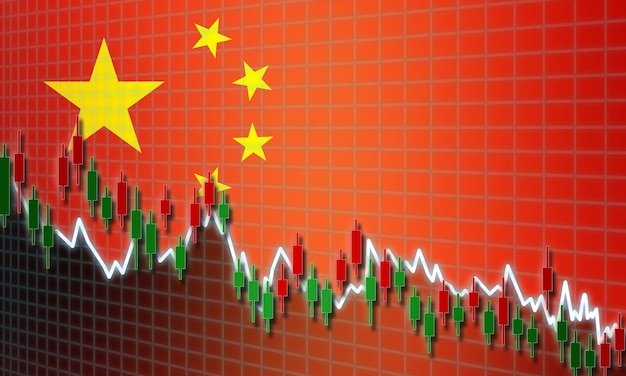
China Annual GDP Growth 2026
4.0–5.0%: 96%
24h vol $5.8K · Ends 2027. g. 1. febr.
Fed Decision in January?
No change: 66%
24h vol $6.4K · Ends 2027. g. 28. janv.

South Africa Annual Inflation 2026
>5.0%: 68%
24h vol $4.5K · Ends 2027. g. 21. janv.

What will Fed Rate hit before 2027?
↑ 4.25%: 79%
24h vol $2.1K · Ends 2026. g. 31. dec.

Bank of Russia decision in December?
No change: 50%
24h vol $1.4K · Ends 2026. g. 18. dec.
Fed Decision in December?
25 bps increase: 75%
24h vol $22.8K · Ends 2026. g. 10. dec.
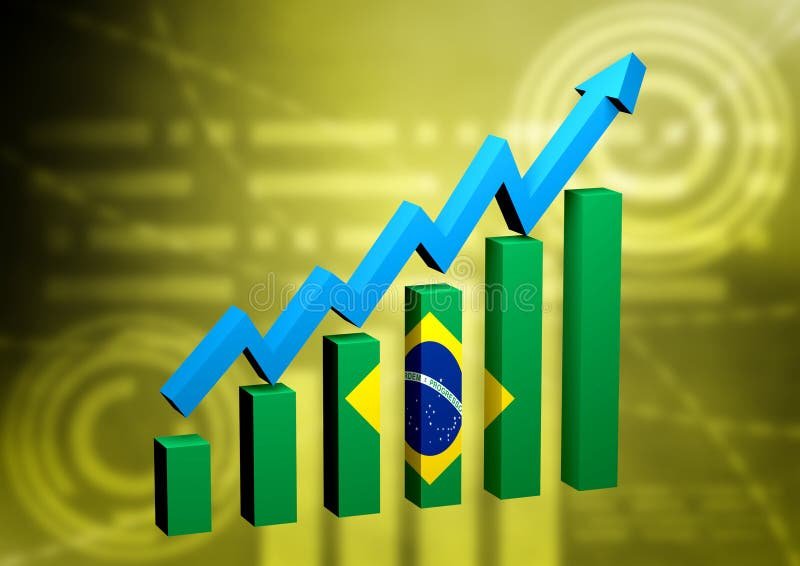
Brazil GDP Growth in Q3 2026 (QoQ)?
-0.3% to -0.1%: 27%
24h vol $846.9 · Ends 2026. g. 2. dec.
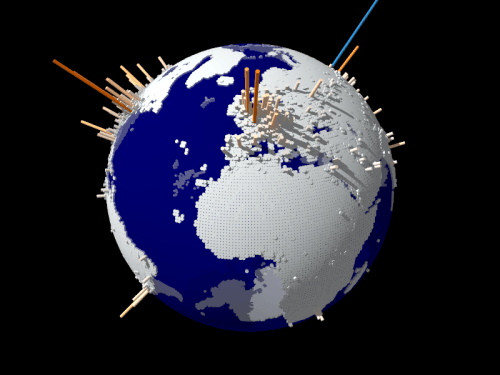
2026 World GDP Growth
3.1%: 31%
24h vol $6K · Ends 2027. g. 1. maijs

October Unemployment Rate
4.2%: 37%
24h vol $1.1K · Ends 2026. g. 6. nov.

Bank of England decision in November?
25 bps increase: 90%
24h vol $1.5K · Ends 2026. g. 5. nov.

Bank of Mexico Decision in November?
No change: 75%
24h vol $981 · Ends 2026. g. 5. nov.

JOLTS Job Openings: September 2026
7.4M+: 29%
24h vol $1.9K · Ends 2026. g. 3. nov.